
Cash Flow Forecast
Cash Flow Projections and Analytics
The Cash Flow Forecast Component lets users track how much money is coming into and out of their company. The widget allows business owners to picture the outcome of financial transactions to understand the impact of their decisions in the future. It is a convenient way to model scenarios that apply to various business cases and processes.
Data Sources
The projected findings are driven by analysis of financial data obtained from accountancy apps and bank accounts that business owners engage with in their day-to-day business activity.
Key Features
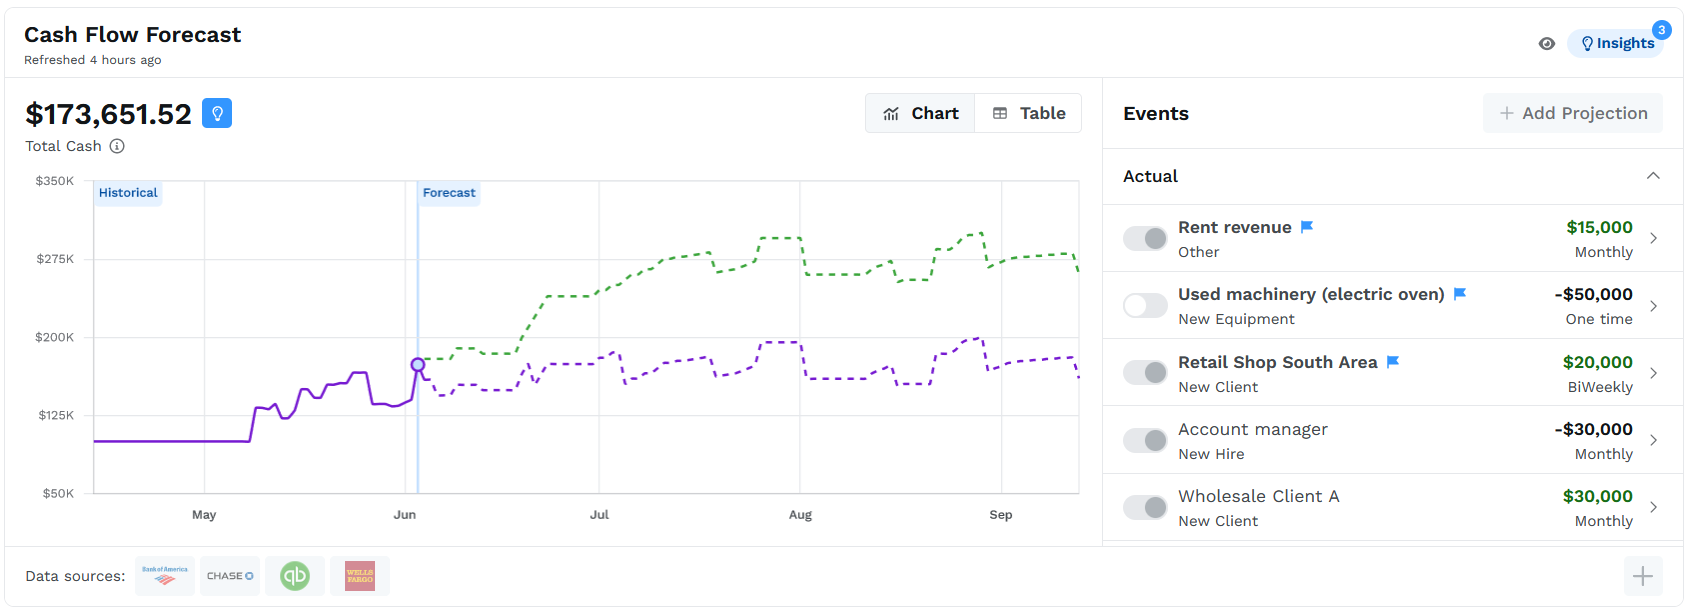
Thanks to the Cash Flow Forecast Component's simple and intuitive tools, users can create custom forecasts for various business scenarios and explore them explicitly on a clear, interactive chart. The Cash Flow chart depicts a forecasted total cash balance based on the aggregated financial data obtained from connected bank accounts and accountancy apps and manually created events that the user adds to the forecast.
Beyond visual presentation, the widget offers a convenient way for users to analyze their cash flow statements in a table using a simple switch to instantly change the view mode. In the table mode, users can choose a particular transaction category, view its historical data by scrolling the feed, and check the details of each specific transaction.
Using the cash flow widget, business owners can add projections (events), deactivate them, or delete them entirely. Creating events enables a detailed breakdown of cash generation and costs, allowing users to effectively manage their exposures and eliminate uncertainties by tracking dependencies they may encounter as business owners. By projecting specific events to the chart, the user can explore the extrapolation of cash flow patterns while shifting around dates for individual cash flow items. Projections are also reflected in the Payment Calendar Component.
Note: the Web Component is in demo mode.
Updated 11 months ago